The environment for health and wellness startups is dynamic and full of highly attractive opportunities. The $1.8T market is massive and growing 5-10 percent annually as it continues to be propelled by meaningful consumer tailwinds.
Consumers are making wellness a top priority as they shift their emphasis from treatment to prevention. “Beauty” items focused on surface appearance, for example, are being supplanted by products and treatments that enhance overall skin health. Supplements are being targeted at consumers’ individual needs, rather than sold as one-pill-fits-all routines.
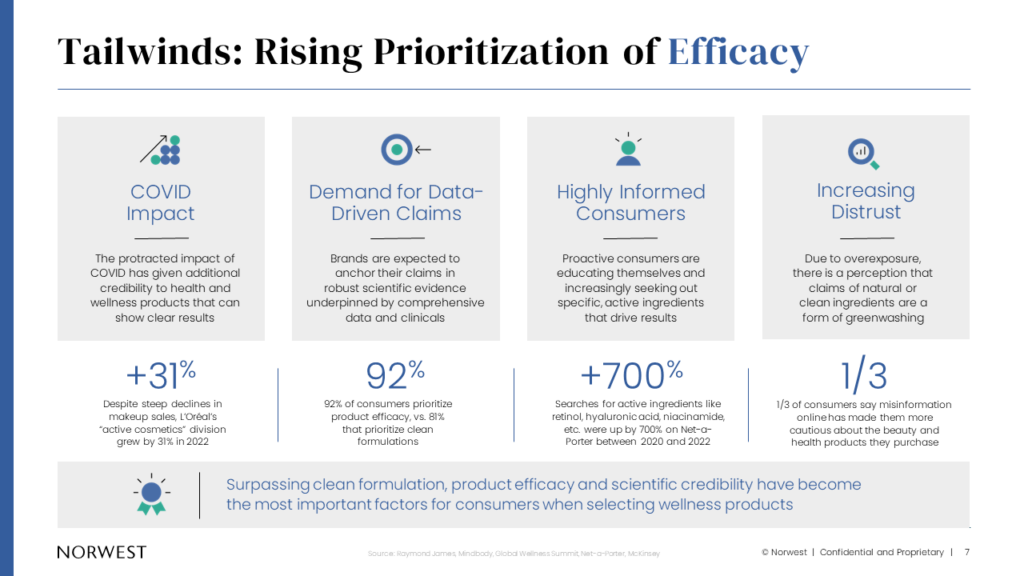
Coming out of the pandemic, science has become more important than ever to consumers. They are increasingly skeptical of claims that aren’t rooted in science and are proactively seeking out specific, active ingredients. Efficacy and scientific credibility are now the most important factors in purchase decisions.
A Bullish Health & Wellness Market
Despite challenging overall market conditions, valuations remain at premium levels, with startups in the space having numerous M&A opportunities. Legacy strategic brands – such as Unilever, Procter & Gamble, and Nestlé – continue to acquire, while private equity firms also remain active. In December 2023 and January 2024 alone, a number of marquee transactions were announced across categories:
- Unilever acquired K18, a biotech-powered premium haircare brand
- Shiseido acquired Dr. Dennis Gross, a dermatologist-led prestige skincare brand
- Otsuka acquired Bonafide, a women’s health-focused supplement brand
- Bridgepoint acquired RoC Skincare, a pharmacist-created anti-aging skincare brand
The buyer landscape also has expanded as major pharmaceutical companies – including Johnson & Johnson, Pfizer, and Novartis – have been divesting their consumer health businesses. These spin-offs – such as Kenvue, Haleon, and Sandoz – are now actively looking for brands to add to their portfolios.
Successful Health & Wellness Companies Follow a Winning Framework
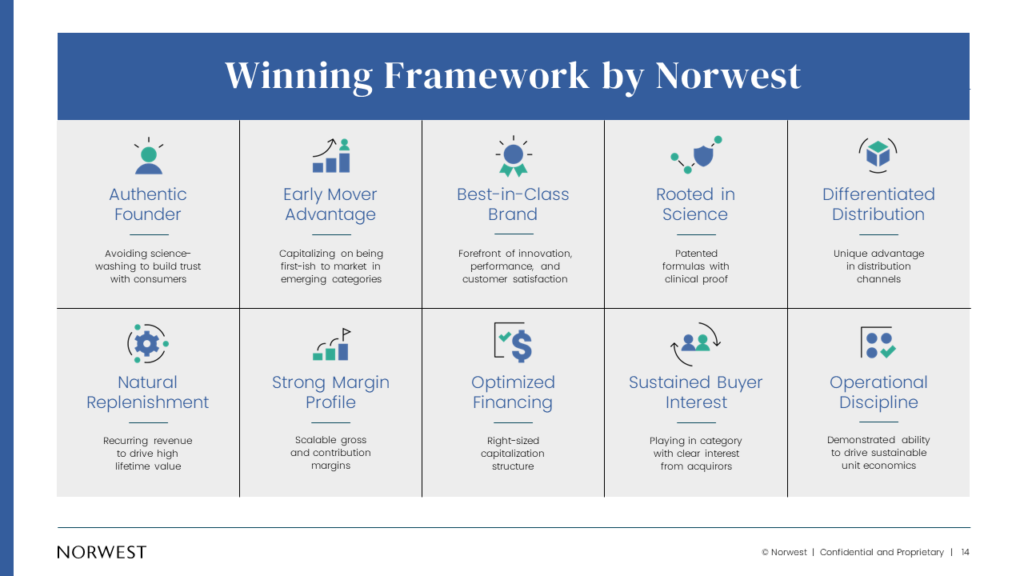
The health & wellness category continues to be ripe for disruption. We believe brands will have the most success if they prioritize key business building blocks from an early stage. The recipe for success starts with our winning framework:
- Authentic Founder – Founding teams are experts in their field. They speak with authority and from experience, giving them a unique ability to build trust with consumers.
- Early Mover Advantage – Being first(ish) to market allows a company to establish strong name recognition and brand/product loyalty. Early entrants have a chance to create an entirely new category and then own it.
- Best-in-Class Brand – Achieving best-in-class status is the outcome of being at the forefront of quality, innovation, performance, and customer satisfaction. It requires a continual commitment to excellence and improvement, and will result in the brand being recognized for the influence it exerts on the industry.
- Rooted in Science – As noted earlier, today’s consumers increasingly demand proof of efficacy. To meet that requirement, companies should prioritize patents, clinical results, credible case studies, and other proof points.
- Differentiated Distribution – Successful brands have established a unique way to reach customers. Through social media, wholesale channels, and strategic partnerships, they offset increasing customer acquisition costs as they vie for new customers against their competitors.
- Natural Replenishment – Creating products or services that consumers use repeatedly will result in a strong base of recurring revenue and high-value, repeat customers, allowing companies to spend more money on marketing to scale.
- Strong Margin Profile – Prioritizing strong gross margins and contribution margins will result in the ability to scale efficiently and invest in growth levers such as marketing and innovation. (Gross margins are total revenues less the cost of goods sold. Contribution margin deducts variable costs such as marketing costs, commissions, supplies, and back-office functions.)
- Optimized Financing – Financing needs can vary widely, depending on the details of a company’s products, markets, channels, and growth expectations. The leadership team should pursue a financing strategy that is appropriate for the scale of the business.
- Awareness of Buyer Appetite – So you build an interesting company, generate healthy revenue and margins, but will any major players in the space care? Founders and CEOs should build their companies in a category where buyers actively make strategic acquisitions.
- Operational Discipline – Founders and their leadership teams must remain focused on driving sustainable growth. Balancing rapid scaling with profitability requires skill and discipline, as well as the participation of all functions in the organization.
Norwest has broad experience in helping health and wellness brands achieve success. Among the companies we partner with are Ritual, PCA SKIN, Calm, Face Reality, Maëlys, and Aesthetic Partners.
These companies demonstrate most or all of the success factors we have described. Ritual, for example, is a science-backed vitamins and supplements leader that gives its customers the assurance of ingredient quality through its Made Traceable program and of product efficacy through clinical testing.
PCA Skin was one of our firm’s earliest investments in this field, more than 10 years ago. It was at the forefront of the trend toward clinical beauty and skincare. PCA Skin became one of the fastest-growing skin-health brands in the physician and aesthetician markets when we sold it to Colgate-Palmolive in 2018.
If you’re a founder, physician, or other practitioner ready to build a health and wellness brand, we want to hear from you. Contact Lisa Wu or Gabrielle Rush.
And for more detail on the market trends discussed at the beginning of this blog, read our full thesis and guidance: “The Future of Health & Wellness Is Science-Backed”.